Carbon emissions performance in ocean container shipping is showing signs of recovery following a record-breaking 12 months due to the conflict in the Red Sea, according to a new Xeneta analysis.
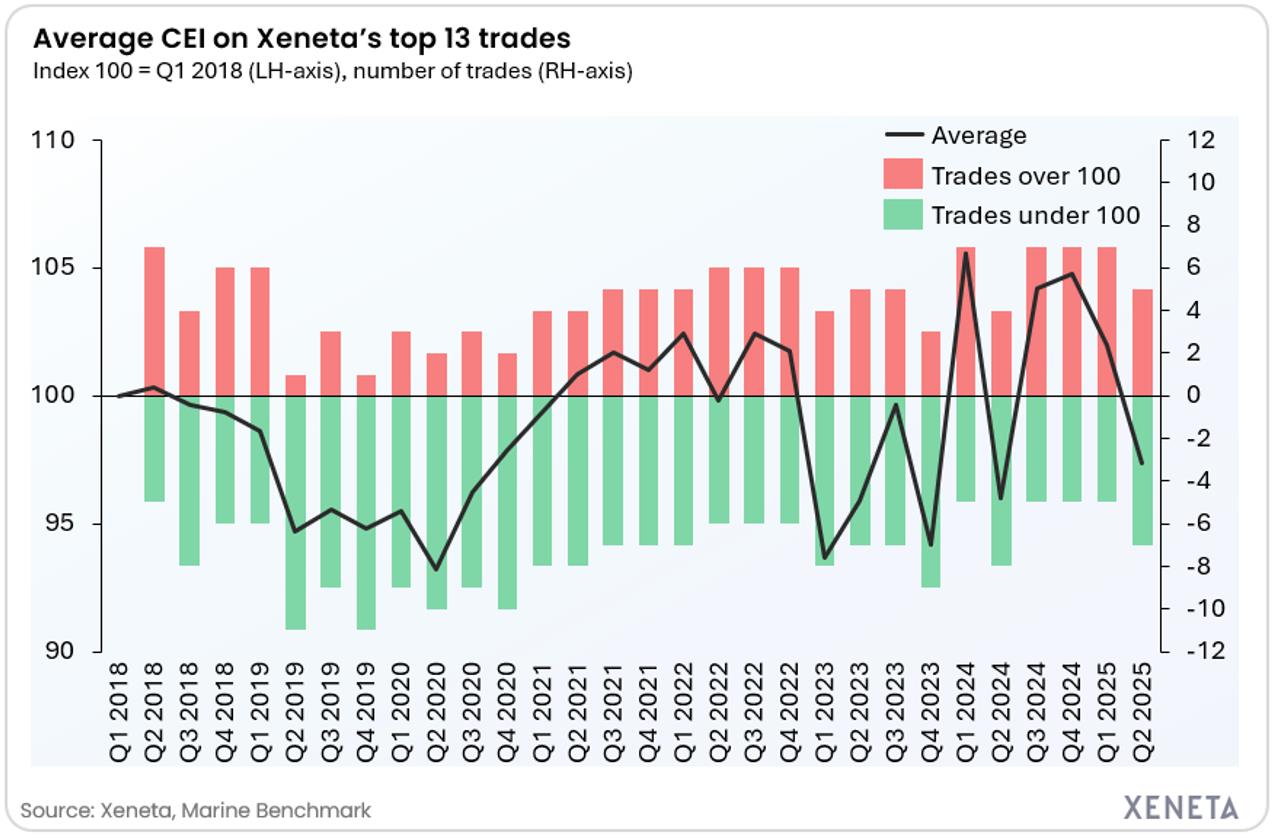
Emily Stausbøll, writing for Xeneta, said the Xeneta and Marine Benchmark Carbon Emissions Index (CEI), which measures carbon emissions across its top 13 global ocean container shipping trades, has fallen below 100 points for the first time in 12 months to stand at 97.4 points in the second quarter of 2025.
The Q2 score of 97.4 is down 4.5% from Q1 2025 and 7% from Q4 2024 when the average index hit its highest ever level at 104.8.
"The Q2 2025 score represents two quarters of consecutive decline and a clear indicator of an improving picture for reducing emissions in ocean container shipping," Stausbøll said in the analysis.
Impact of the Red Sea disruptions
Record-breaking carbon emissions in 2024 were driven by conflict in the Red Sea, with the majority of container ships sailing longer distances around the Cape of Good Hope rather than transiting the Suez Canal.
The analysis pointed out that this caused severe deterioration in carbon emissions performance on trades connecting the Far East with ports in the Mediterranean, North Europe, and to a lesser degree the North America East Coast and Gulf Coast.
Xeneta noted that the CEI is based on Q1 2018, meaning any reading above 100 indicates carbon emissions per tonne of cargo carried are above levels from that period — and the fact that the average CEI across Xeneta's top 13 trades hit 104.8 in Q4 last year demonstrates the scale of the Red Sea impact.
The analysis said the Q2 2025 CEI score of 97.4 is still slightly higher than the 96 points recorded 12 months ago in Q2 2024. However, a more interesting comparison may be found with Q2 2023 - before the conflict in the Red Sea escalated in December of that year – when the CEI stood at 95.9.

"The crucial context is that the majority of container ships continue to sail around the Cape of Good Hope in 2025, yet carbon emissions performance on the top 13 global trades in Q2 this year has narrowed to being just 1.5% higher than Q2 2023, when most ships still transited the Suez Canal," Stausbøll said.
"This clearly demonstrates that, if there is a resolution to the conflict and the Red Sea opens up at large, carbon emissions performance at a global level would drop significantly below the levels seen in 2023."
Xeneta said unsurprisingly, the Red Sea affected routes continue to stick out, with the fronthaul and backhaul trades connecting the Far East with North Europe and the Mediterranean remaining above 100 points in Q2. However, the fronthaul trade into the Mediterranean is down 4.3% compared to Q1 at 126.3 points, while the trade into North Europe is down 0.2% at 107.5. Both trades are down year-on-year at -12.8% and -2.7% respectively.
It added that the best-scoring trades on the CEI are Far East to US East Coast at 71.2 and Far East to US West Coast at 71.1.
The trade into the US West Coast – unaffected operationally by the Suez Canal— is now on its tenth straight quarter below 80 points, the only trade on the CEI to reach this milestone.
"Again, to have two of the world's major fronthaul trades beating the CEI baseline so comprehensively suggests genuine progress has been made in reducing carbon emissions in recent years, despite the geopolitical headwinds," Stausbøll said.
She added that the biggest CEI improvement in Q2 came on the US West Coast to Far East backhaul — but not a result of higher US exports, but rather a reduction in capacity on the fronthaul trade, which increased the filling factor on the backhaul trips.
The analysis said higher sailing speeds were also due to carriers needing to redeploy ships across trades as quickly as possible in response to rising and falling demand in the wake of tariffs – for example, capacity was shifted off US-bound trades onto Far East to North Europe and South America East Coast trades when demand fell off a cliff in the aftermath of U.S. President Donald Trump's reciprocal tariffs in early April.
Meanwhile, the report noted that ship size is also a "key factor" in the CEI score. It said that North Europe to South America East Coast is not operationally impacted by the Red Sea, however, it recorded a CEI score of 114.4 in Q2 2025 – up 15% compared to a year ago.
"Since the CEI score is based on emissions per tonne of cargo carried, larger ships offer the highest efficiency."
However, Xeneta pointed out that carriers' efforts to manage capacity in the wake of the U.S. trade wars and global demand volatility saw an average ship size of 7,400 TEU deployed on the trade from North Europe to South America East Coast in Q2, down 14% (or 1,200 TEU) year-on-year, pushing emissions per tonne of cargo carrier up.
"When looking across the CEI, CMA CGM and HMM lead the pack in Q2 2025, with both taking top spot as the best performing carriers on three out of the top 13 trades," Stausbøll said.


